Update 25.6.2015: The process of creating Google Analytics reports in Google Sheets is now much more user-friendly, thanks to the official Google Analytics Add-on. Check out our updated tutorial.
As web analytics are becoming more and more important for many companies, the daily workload of analysts is increasing. Many times the tasks are really interesting, but there are also some repeating, boring tasks that can be automated. Wouldn’t it be great if you could free some time of the weekly and monthly report creation and spend more time in data analysis?
Well, thanks to Google Analytics Automation Script, it is now easier than ever to integrate Google Analytics data with Google Docs and decrease drastically the required time for report creation. You can use it for calculations, to create reports including tables and charts or to add an auto-update functionality.
In this tutorial, we are going to create a daily report with data from Google Analytics, which is updated every 24 hours and can be exported as a pdf file. The tutorial will also show how to update the fields of the report and how to add more pages.
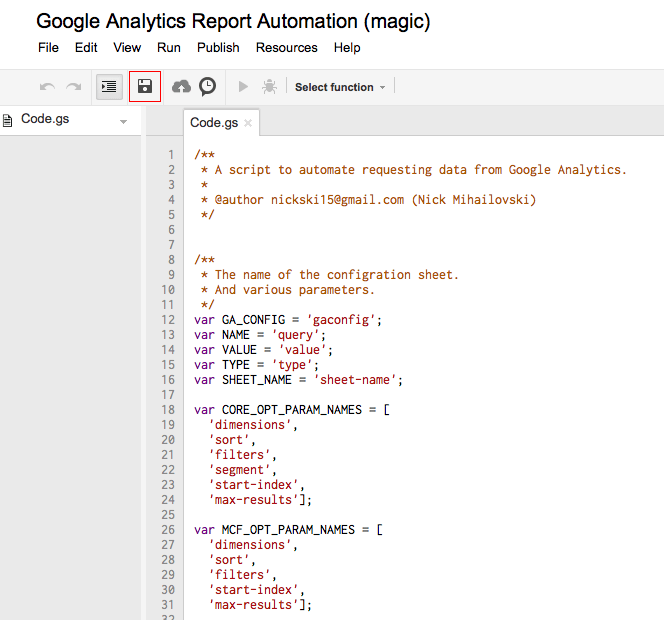
1) The first step is to create a new spreadsheet in Google Docs and give it a name. Then, go to Tools -> Script Gallery and search and install the “Google Analytics Report Automation (magic)” script.

2) Before the script is installed, you have to enable it and allow it to access your Google Analytics data.
In order to enable the script, go to Tools -> Script Editor and in the new window that opens go to Resources -> Use Google APIs.
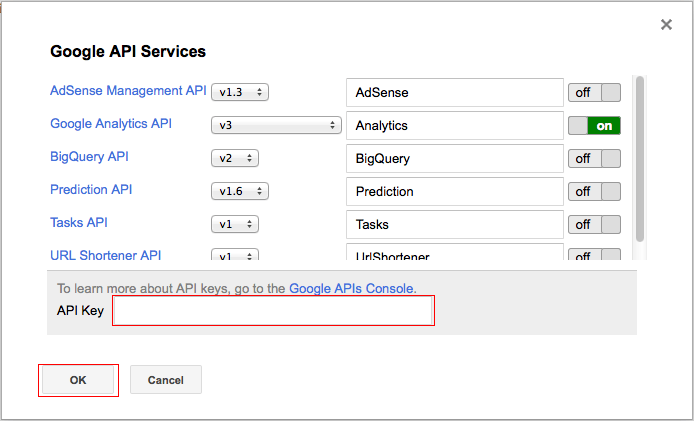
Enable the Google Analytics API in the Google APIs Services window and then click on the “Google APIs Console” link.

3) In the new window, first accept the terms of service and then select API Project -> Create from the top-left menu and create a new project.

4) Then, locate the analytics API service and enable it.

5) Finally, go to the “API Acess” tab, copy the API key
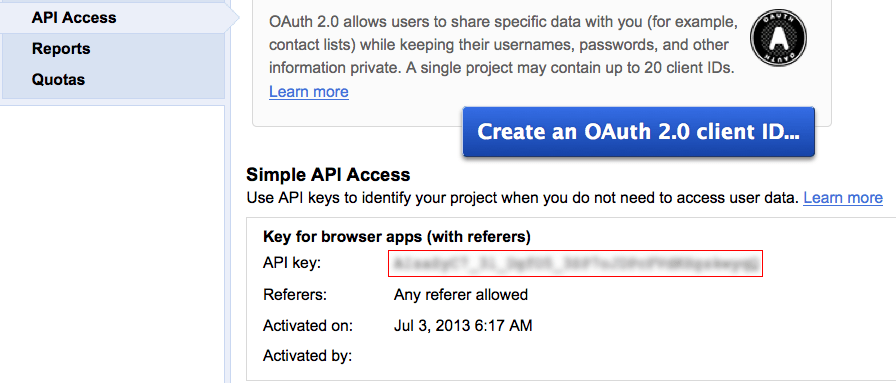
6) Paste it into the API key field on the previous window and click OK to close the window.
7) Finally, click “Save” on the Script Editor window to store your settings.
8) That’s it! The Google Document is connected to Google Analytics and ready to import data. You can see a new element in this worksheet: a new menu item named “Google Analytics” that provides all the required functionality for the data connection.

In the second part of this blog post we will examine how the report is created and how it can be updated automatically.