
User Engagement Metrics measure what users are actually doing with your website, and how. Web analytics platforms like Google Analytics offer some standard engagement metrics like Average Time on Page, Session Duration, or New Users and engagement reports like the Frequency & Recency Reports. These are a good start, but they do not offer much insight into the user behaviors that are unique to your website.
How can you dig deeper into understanding your website traffic as people with patterns of behavior rather than just sessions and pageviews? There are some excellent web analytics tools that promise to help you understand real users, like Woopra, Mixpanel and KISSmetrics, but these can be very expensive, depending on a website’s traffic.
If you’re willing to do some work configuring Google Analytics, you can also set it up to capture and report valuable data about user engagement. Here are the most important steps:
1. Set Engagement Goals
To start to evaluate user behavior, you first need to decide what you would like user engagement with your website to be. Do you want a user to click on a “Contact us” button and then fill out the contact form? Do you hope they will be attracted by a featured article, click on it to view the page, and then scroll all the way down to the bottom as they read?
Setting these goals will allow you to measure the real user behavior against your desired goals.
Here are some different types of websites and examples of the engagement goals they might set:
- Not-for-profit website: user clicks on a “Get Involved” button, user signs up for a newsletter, user makes a donation
- Ecommerce website: user completes checkout process, user clicks on “Add to Cart” button
- Media website: user views a video until the end, user scrolls to the bottom of an article, user views more than two articles

Once you have clarified your engagement goals, you should set up these as Goals in Google Analytics so that you can see them in your analytics reports. See Google Analytics Help for detailed instructions. You may have to set up event tracking for some goals: the next step introduces event tracking.
2. Track Engagement Events
Once your goals are clear, you should know exactly which events (which clicks, scrolling, mouse movements) you need to track. We have written about event tracking in our Google Tag Manager Guide: Step-by-Step Tutorial for Event Tracking.
Event tracking can also be used to identify users as having behaved in a certain way by setting Custom Dimensions for users. This lets you segment your analytics reports into groups of users and recognize patterns in these groups (behavior cohorts). For example, you might find that the users that read full articles behave differently from the users that skim titles.
Here are some examples of custom user dimensions that you might use in different cases:
- Not-for-profit website: Donor Type (non-donor, silver-level, gold-level, platinum-level)
- Ecommerce website: Buyer Type (no-purchases, under-$100, $100-$250, $250+)
- Media website: Reader Type (read-title, read-25%, read-50%, read-75%, read-100%)

Setting up these types of custom event tracking and custom dimensions is not easy, but it is worth the effort. You will be able to super-power your analytics reports, segmenting them into groups of user types to better understand the differences in their behaviors.
You will need a qualified developer or a Google Tag Manager expert to implement custom event tracking. See Google Analytics guidelines for more information on how to set up event tracking and custom dimensions.
3. Track Real Users
What if you want to dig even deeper into your web analytics data to understand what paths an individual user followed through your website?
With some careful setup, you can. One of the major improvements that Google Analytics made with the introduction of Universal Analytics was the User ID feature. This lets Google Analytics track users across different devices and attaches all the data about a users’ behavior to a specific anonymous ID. If you have data about your users, for example from a CRM or other customer database, you also can combine what you know about your customers with their online behaviors by configuring the User ID feature and importing your customer data.
Here are some examples of how analytics reports might be enriched with imported user data in different cases:
- Not-for-profit website: Reports segmented by volunteers vs. non-volunteers
- Ecommerce website: Reports with lifetime customer value metrics
- Media website: Reports on offline subscribers as well as online subscribers
To do this, you will first have to set up the User ID feature in Google Analytics and then you will need a qualified developer or Google Tag Manager expert to implement the User ID.
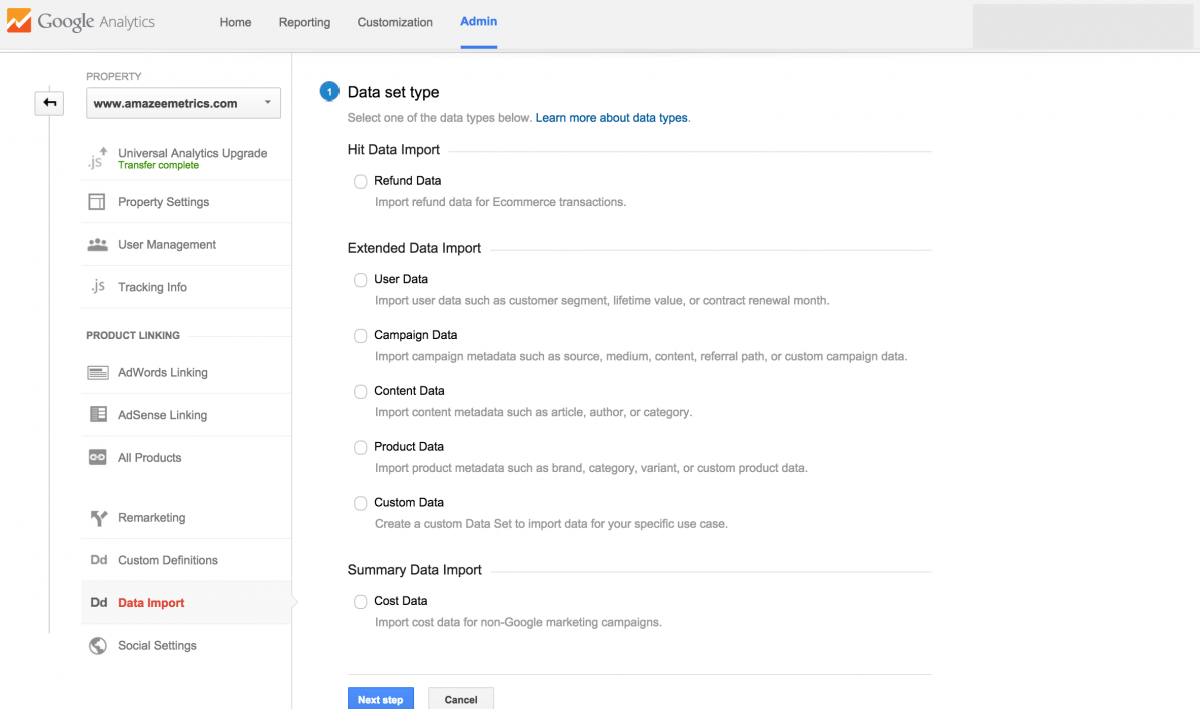
Then you must import data from your CRM or other user database into Google Analytics. You can do this through the Google Analytics web interface under Data Import.
Getting all of these custom features set up for Google Analytics is not easy, but it can make your web analytics reports much more powerful and insightful tools. Of course, we are here to help. Email me to learn more about how Amazee Metrics can help super-power your web analytics.