In Google Analytics you can use Treemaps to understand how traffic arrives at your website. In this tutorial, we explain how they work and how you can use them.
What are Treemaps?
Treemaps are a type of visualization that represents data as rectangles. Each segment of data is a rectangle. The sizes of the rectangles communicate the size of that segment. The color of the rectangle shows how that segment measures for a different, secondary metric on a scale of high (green) to low (red). You can find Google Analytics Treemaps under Acquisition > All Traffic > Treemaps
How to make use of Treemaps
Treemaps can be used to easily visualize and understand the performance of landing pages, campaigns or conversions and thus detect optimization potentials.
Step by Step: Understanding Treemaps
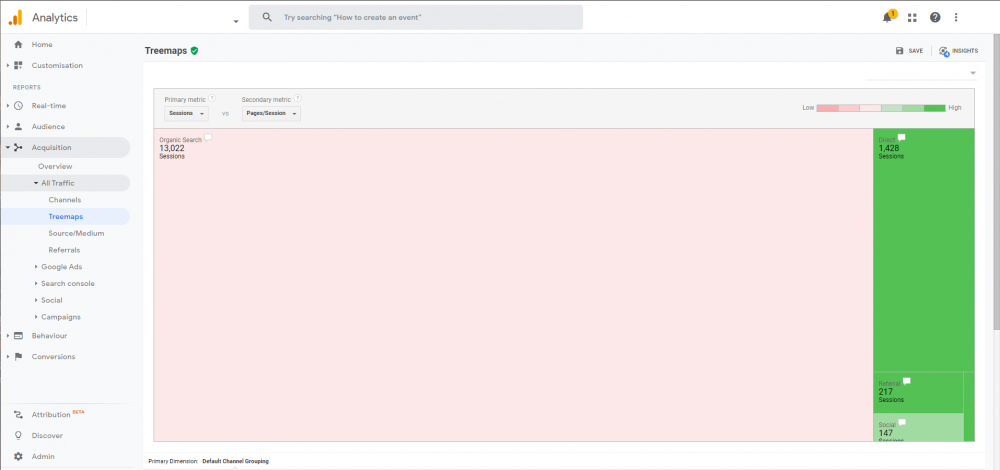
In the screenshot below, for example, the color indicates Pages / Session. You can easily see that while Organic is the channel responsible for the most sessions (it is the biggest rectangle) Direct is the channel with the highest Pages/Session (it is the darkest green).
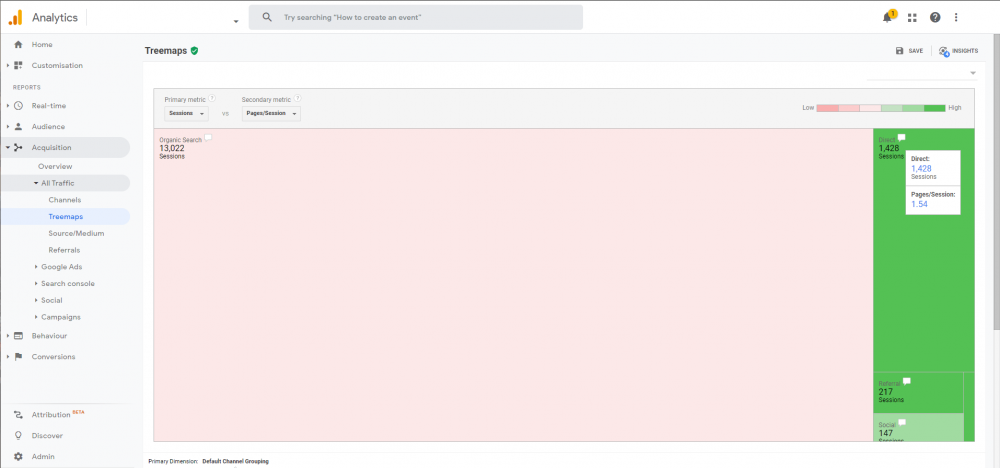
By hovering over the dialog icon in the rectangles, you can see the value of the metrics.
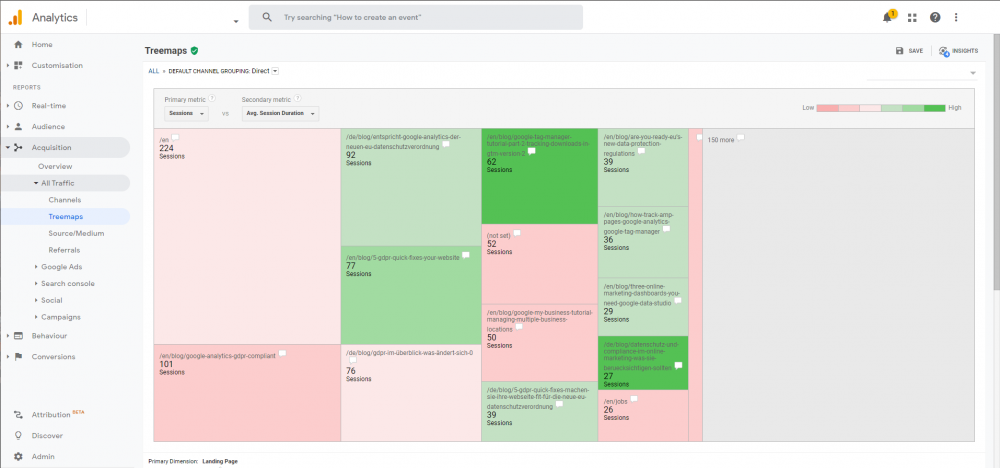
By clicking on the rectangles, you can drill down to see more details about the segment. For example, clicking on the Social channel will break down the selected metrics by different social networks, while clicking on the Referral channel will show the performance of sessions by the different referrers. Here you can see the specific landing pages that had direct traffic, measured by how many Sessions each had and how many Pages/Session began with each page.
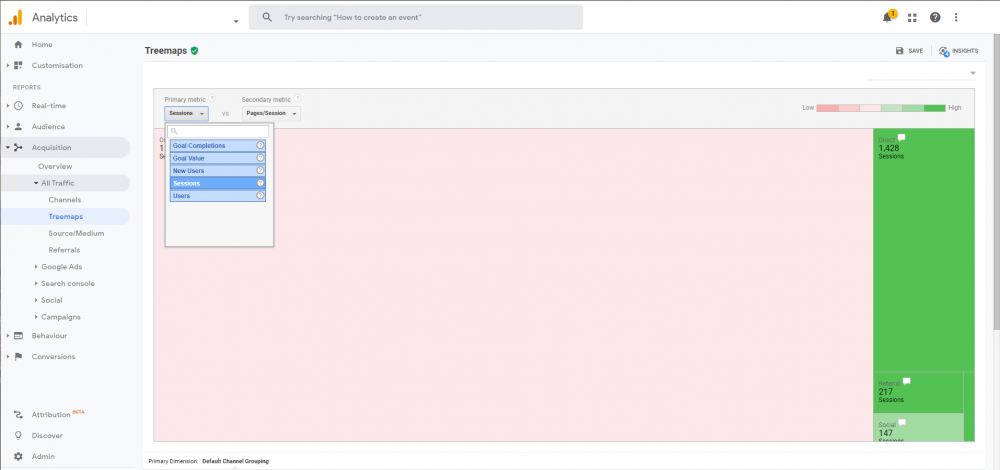
You can change the Primary and Secondary Metrics of the Treemap to generate different kinds of insights.
What Can Treemaps Tell You?
Treemaps let you quickly identify which channels are performing best, across a variety of different metrics. Some examples of questions you can quickly answer with Treemaps :
- Which social network referred the most sessions to my website?
- Are there differences in the level of engagement of users from different social networks?
- Which referrers send the newest users to my website?
- How does my conversion rate compare for different landing pages?
- Is there a channel that sends less overall traffic but has a better conversion rate than others?
For more details on Treemaps, see Google Analytics Help.