Earlier this year Google announced an unrestricted free version of their reporting and visualization tool, Google Data Studio. Data Studio allows you to create informative and attractive reports from your data. These reports can easily be built and customized from a growing set of data sources.
In this blog we will show you three basic dashboards you can build in Google Data Studio which give you a good overview of your online marketing activities.
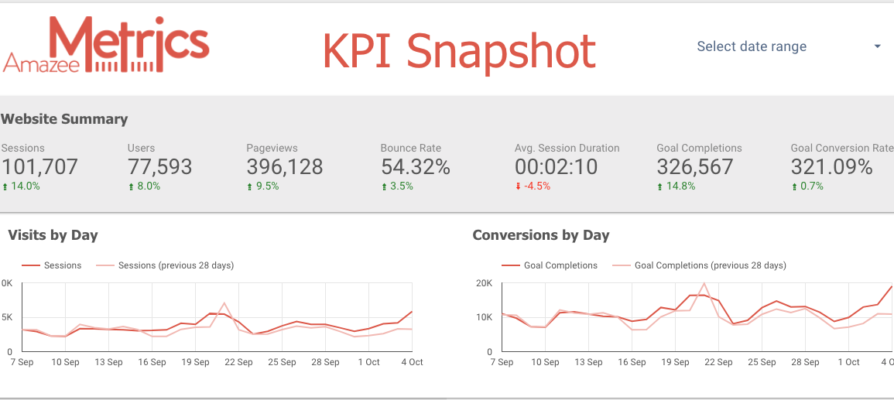
Dashboard 1: KPI Snapshot
The first dashboard is your Key Performance Indicator (KPI) Snapshot. This report gives you an overall view of the performance of all your digital marketing activities in one place. It is very helpful in determining the health of your website and your online campaigns at a glance.
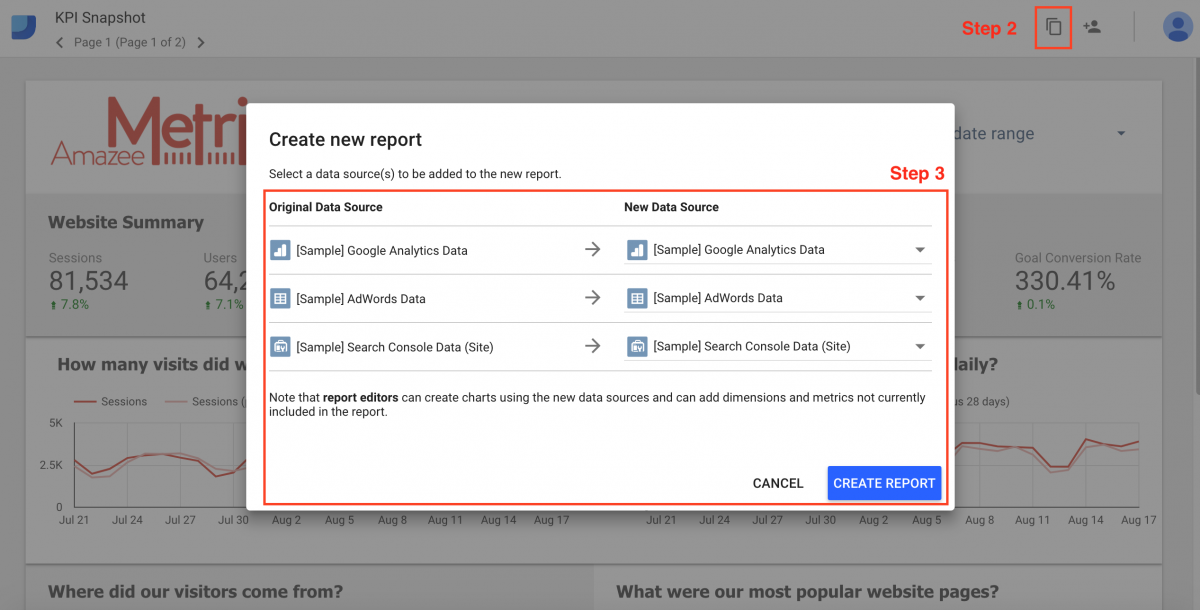
We have built a two page KPI Snapshot template for you to use. To copy it:
- First, click here to access the report.
- Click the “Make a copy” button in the top right hand corner of the screen.
- Connect your own data sources to the report. You will need to have Google Analytics, Google Adwords and Google Search Console Data Sources for this report. If you don’t know how to create a Data Source then take a look at our introduction to Google Data Studio.
The KPI Snapshot shows vital statistics about your website including visits and conversions, which country your visitors are from, and what the most popular pages on your site are.
The KPI snapshot also includes campaigning information like which channels brought the most traffic and which had the best converting visitors. Finally, it shows you the top AdWords campaigns and the top organic search queries.
Once you have setup your KPI Snapshot you are able to customize it to meet your exact needs. You can change, add or remove any data you would like.
For more detailed views of your data you can create more specific reports. The next two reports will give you more details about your Search Engine Optimization and Paid Search Engine Advertising efforts.
Dashboard 2: SEO Report

For many businesses the organic search channel is the key channel bringing visitors to the website. Users searching on Google for your offering or for your business are potential customers. Unlike paid search advertising there are no additional expenses for each new visitor.
Search Engine Optimization is the process of improving your website’s ranking in the organic search results. As Organic Search can be so important in bringing traffic to a website SEO is an important digital marketing activity.
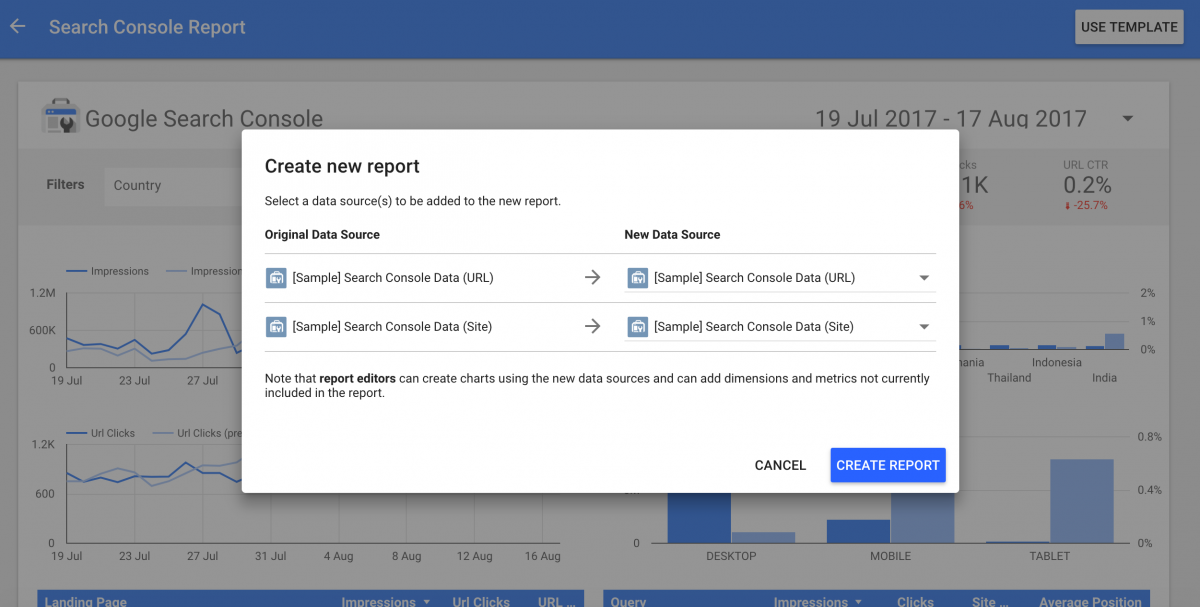
Importing your data from your Google Search Console into Data Studio allows you to create a report to check on the progress of your SEO efforts. Google has a built in Search Console template for you to use.
The template allows you to filter all the data by the Country and Device in which searches took place. It includes impressions and clicks for the top Landing Pages and Search Queries. In addition, it shows the Average Position your website appears in for each Query.
To add the template:
- Click on the Search Console Report template on the home page of Data Studio.
- When the report loads click Use Template.
- When the pop up box opens change the sample data sources to your Search Console Data Sources. You will need to create both a URL and a Site Search Console data source for this template.
Dashboard 3: AdWords Report
Your AdWords advertising is often the most important part of your paid digital marketing program. Getting a simple performance report can be tricky in the AdWords platform. Data Studio provides a much easier way of creating this kind of report.
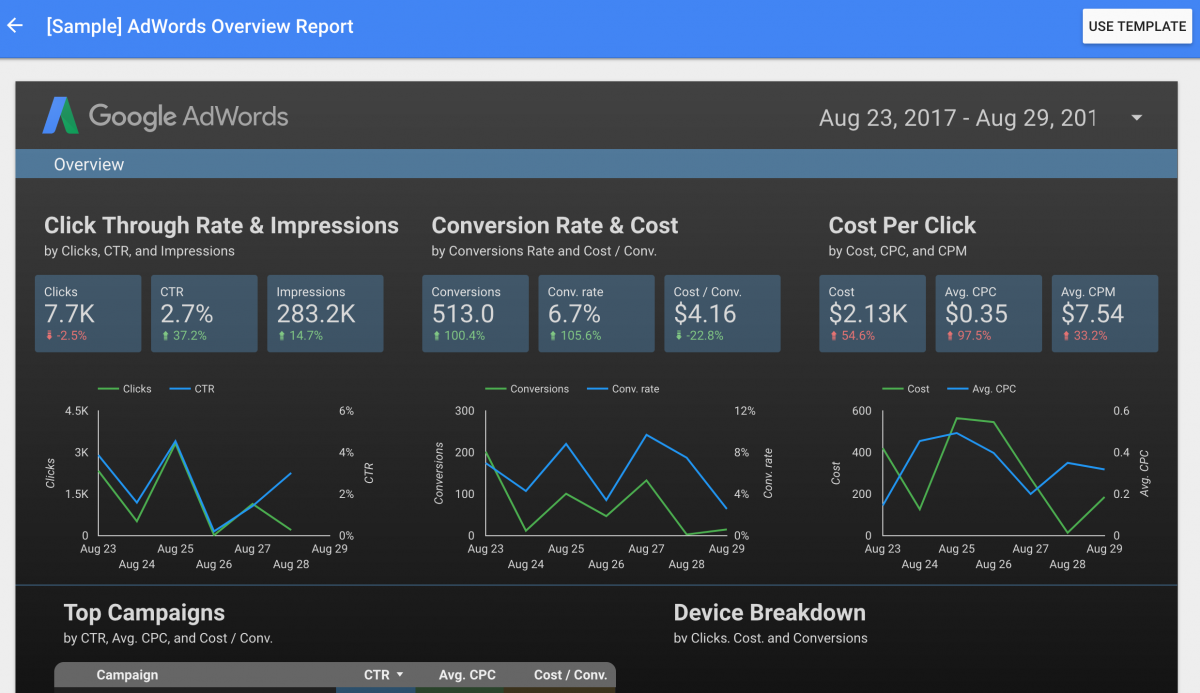
The Data Studio template for this report is called “AdWords Overview”. It provides useful trend information such as Click through Rates & Impressions, Conversions & Cost, and Cost Per Click. It also shows information for your top campaigns and a performance breakdown by device.
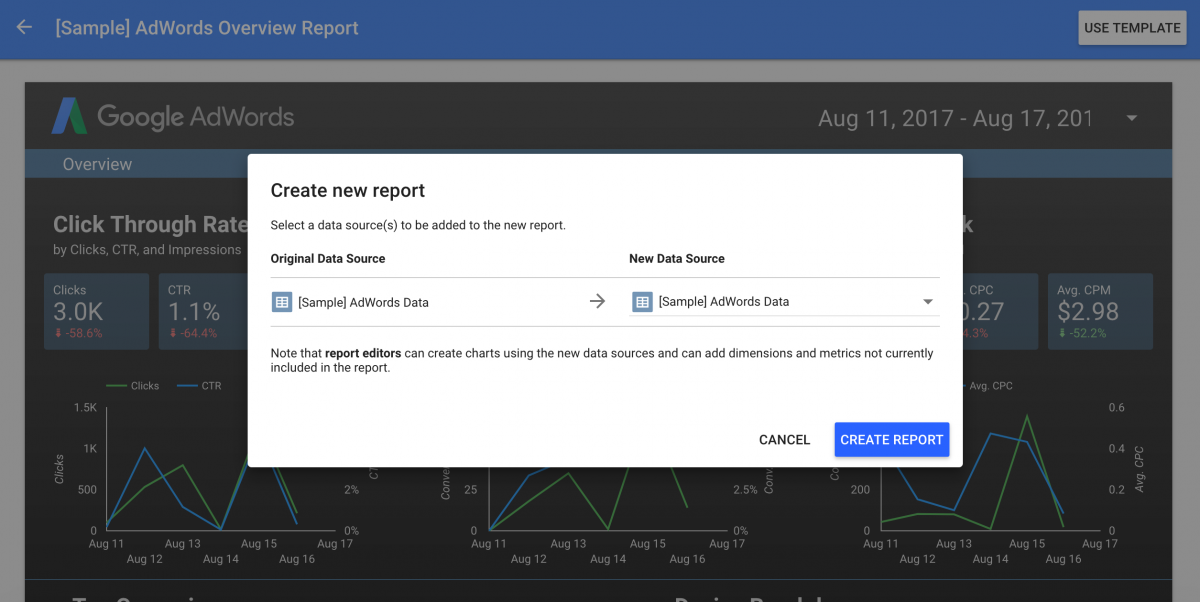
To add the template:
- Click on the Adwords Overview template on the home page of Data Studio.
- When the report loads click Use Template.
- When prompted change the Data Sources to your Adwords Overview and click Create Report.
We would recommend modifying this template to include some additional performance information like your top performing Ad Groups or Keywords.
To do this:
- Make a copy of the Top Performing Campaigns widget.
- In your new Widget change the dimension to Ad Group or Search Keyword.
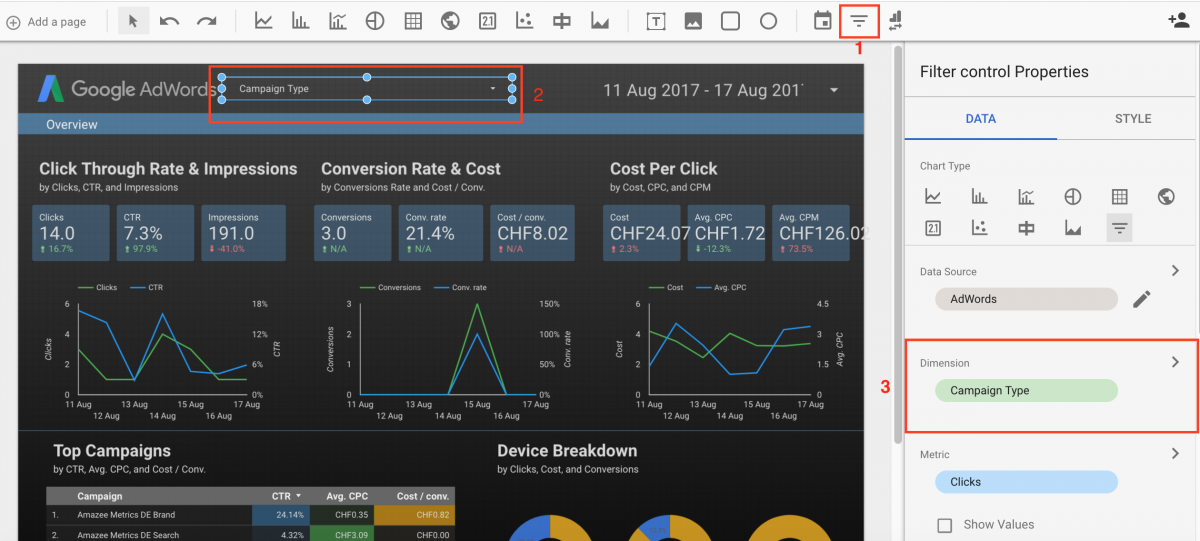
For those who are running both Paid Search and Display advertising on the AdWords network a filter should be set up to view the report for Paid Search, Display or both. This would be similar to the Country and Device filters seen in the Search Console report.
To do this:
- Click on the Filter Control button in the top menu bar.
- Draw the rectangle where you would like your filter to be.
- Change the filter’s dimension to Campaign Type.
If you have any questions or comments about these reports or Google Data Studio in general, feel free to email me.