In our previous blog post, we provided you with an overview of what exactly app analytics is and how to best choose the right tool based on important key factors. We have done this tool evaluation ourselves and would like to introduce our winner: Amplitude! We will take a close look at the tool with you and examine its main features. And we will answer the question – Does Amplitude deliver what it promises?
What is Amplitude?
Amplitude is a tool for behavioral analytics data, both for your web and mobile apps. It is an event tracking and segmentation platform that allows you to analyze your users’ actions, so you can gain a better understanding to drive retention, engagement, and conversion. In simple terms: It helps you understand your users’ behavior and tells you which features work to drive business outcomes!
Overview Of Its Key Features
Behavioral Analytics
Behavioral data is vital when you want to find your app’s ‘magic threshold’ that users need to cross to become fully engaged.
This data tells you how your customers behave in your mobile app and it goes beyond basic metrics such as monthly active users or screen views. Amplitude actually reveals how engagement with your product impacts your main KPIs. Understanding user behavior is necessary to increase retention, lifetime value, conversion rates, and ultimately, revenue. Amplitude provides you with all the features you need to test which user actions lead to growth and success.
Behavioral cohort analysis to identify user retention and find out on a more granular level why users churn: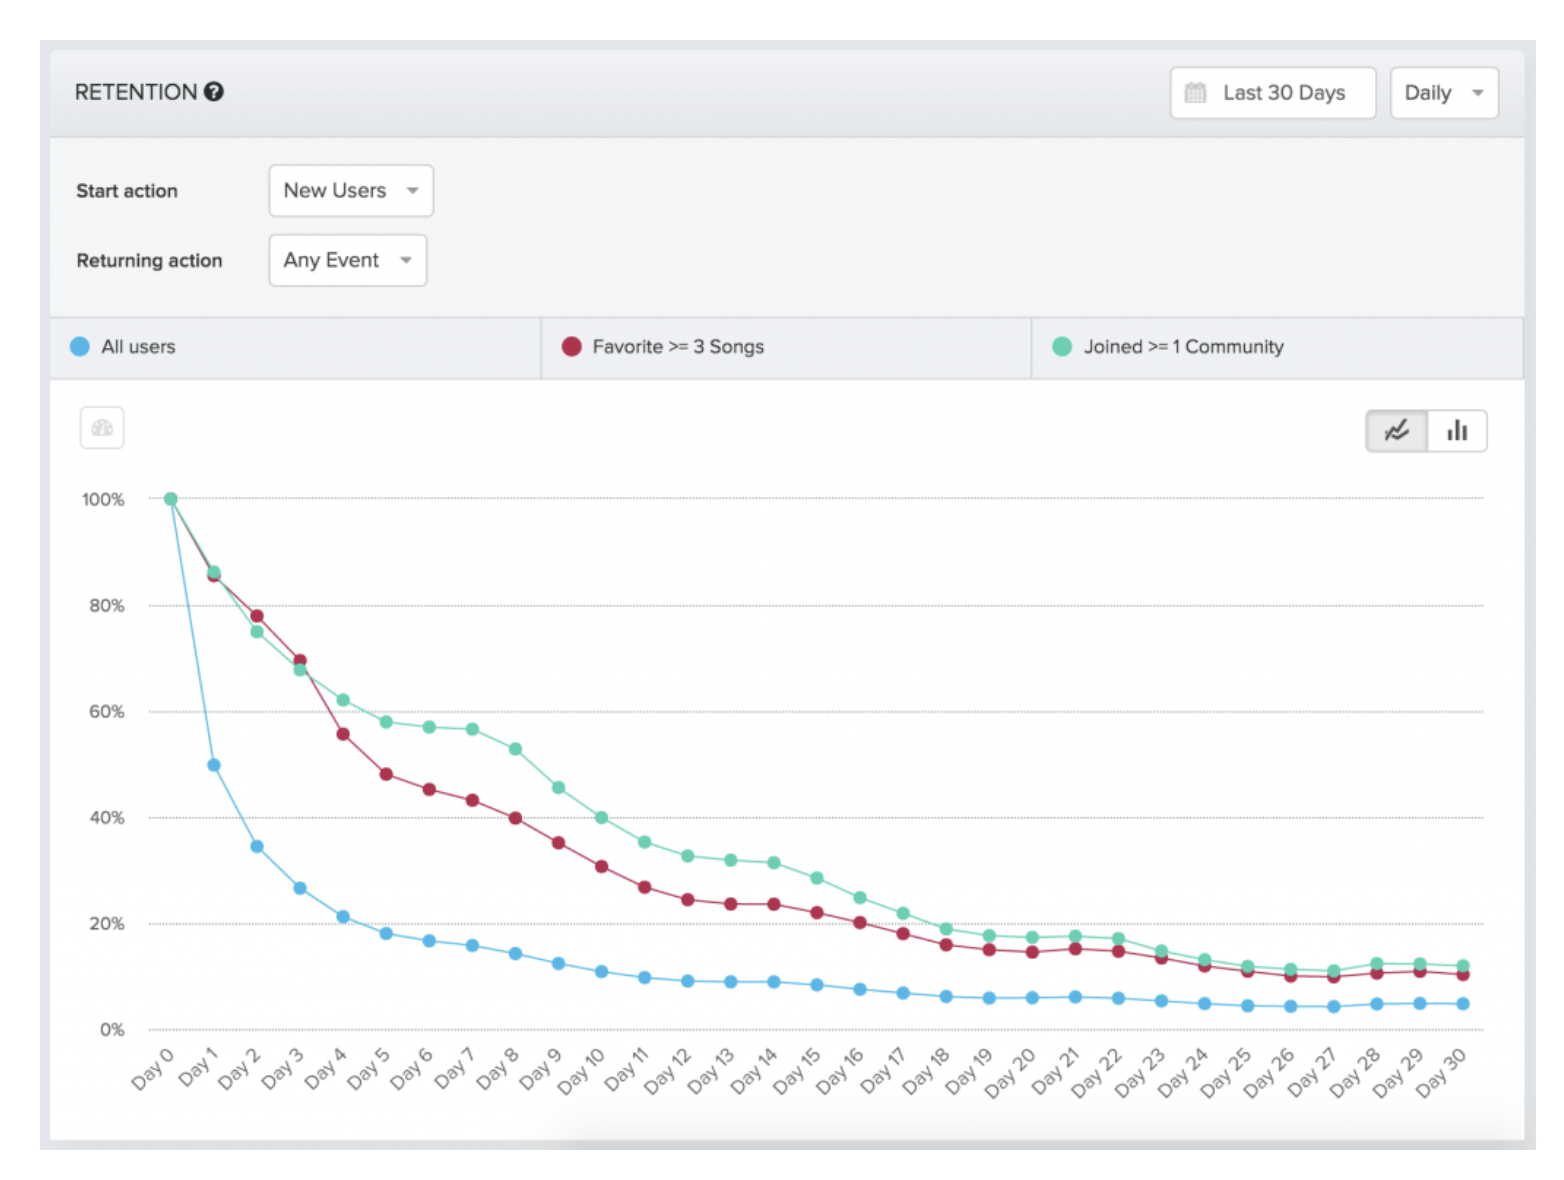
The graphic shows different user groups and how often they use a specific app. It shows that new users, who join a “community” right at the beginning or save more than three songs in their favorites, use the app more frequently in the following days. Therefore, joining a community is crucial and the main goal when opening the app for the first time.
Conversion Drivers
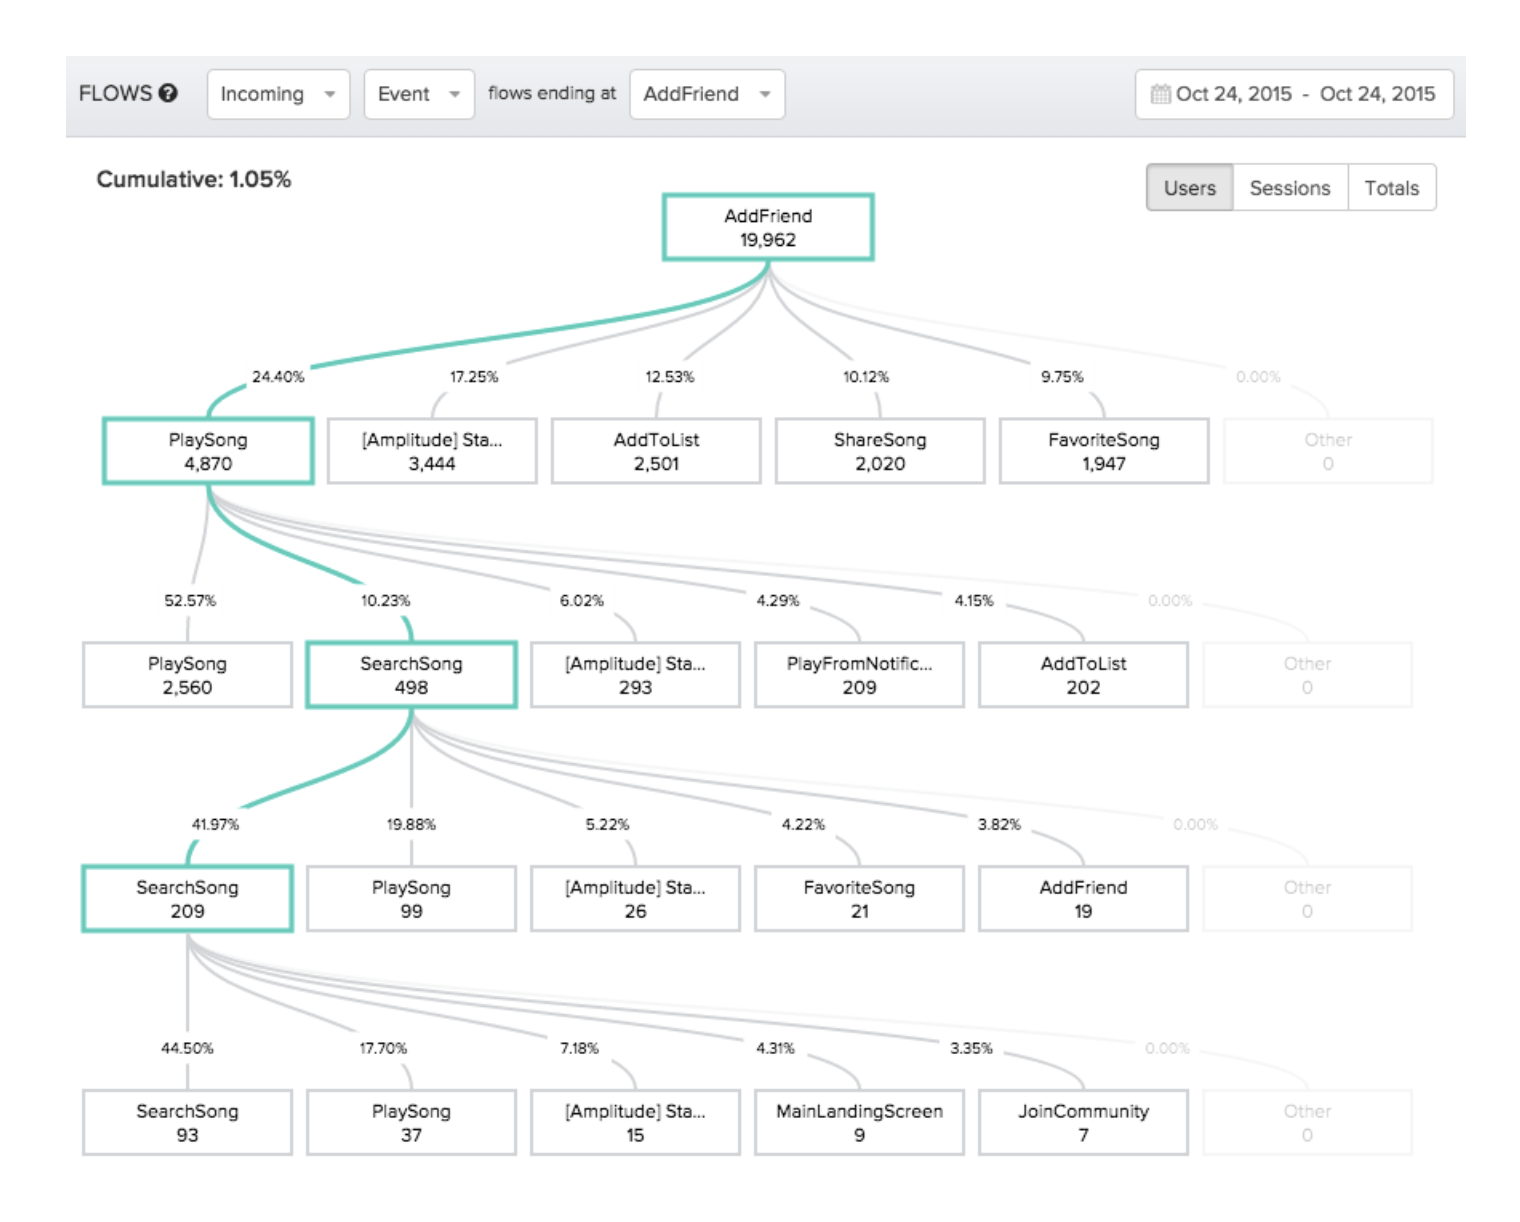
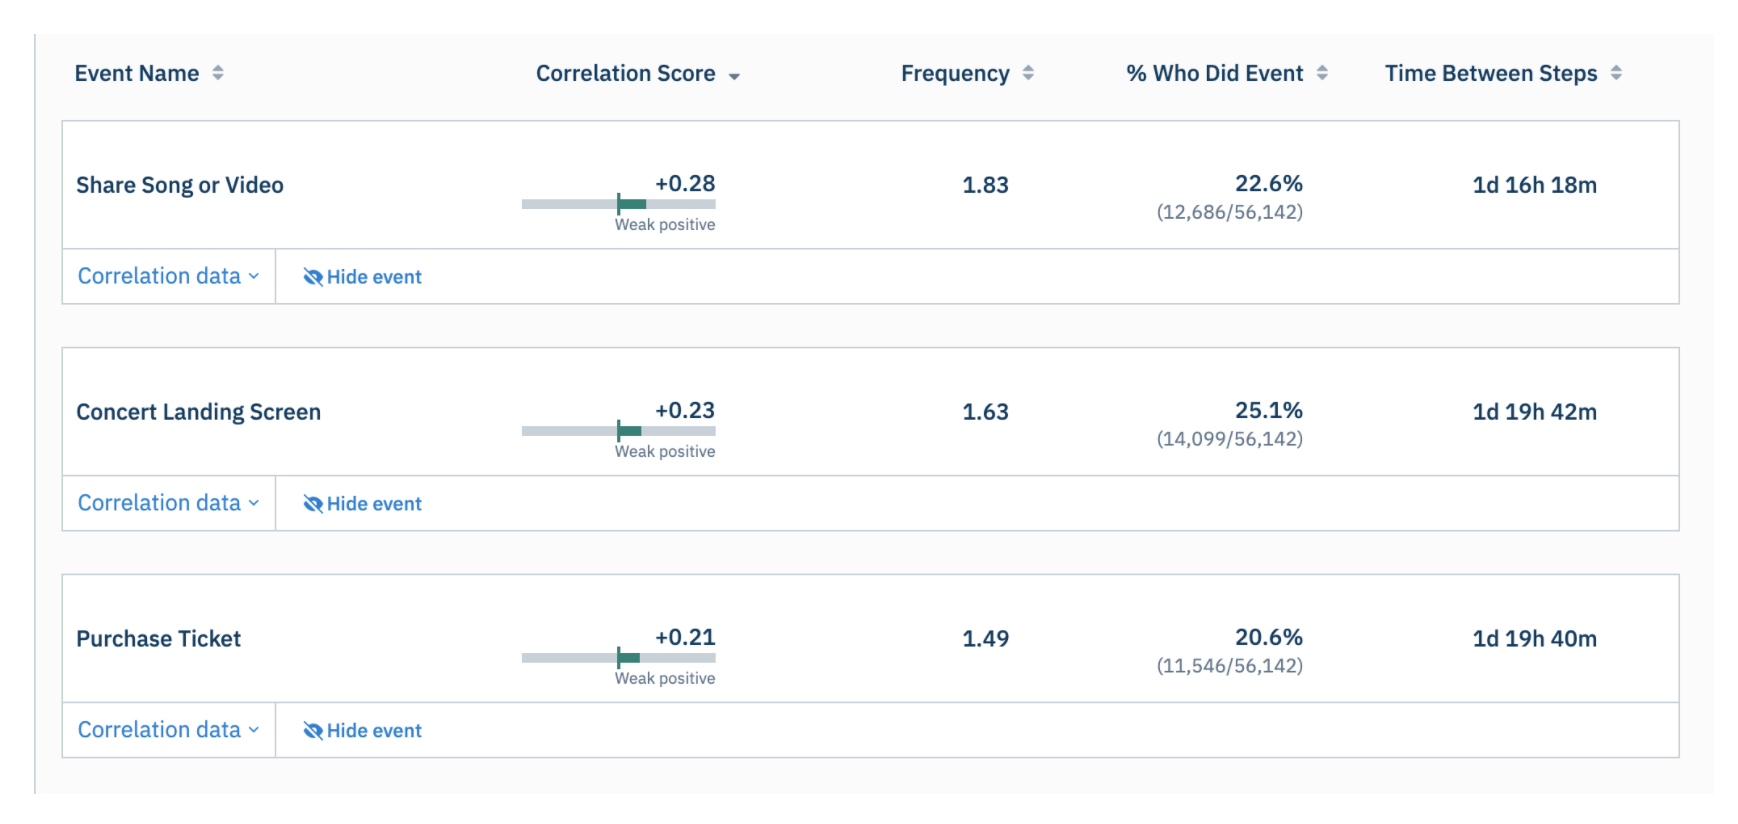
This is another focus area of Amplitude: Their analysis tools will help you understand the path to your conversions better and, especially, where drop-offs occur. Amplitude’s so-called “Conversion Drivers” work in conjunction with the funnels (two-step or multi-step) that you have set up. You can use Conversion Drivers to see what your users/customers are doing in the gaps between funnel steps.
This allows you to deep-dive into the outcomes with statistical results in your key metrics. Such tables include:
- Correlation scores
- The percentage of users taking each action
- The frequency at which the action is performed
- The overall time it took
Discover user paths and conversion drivers:
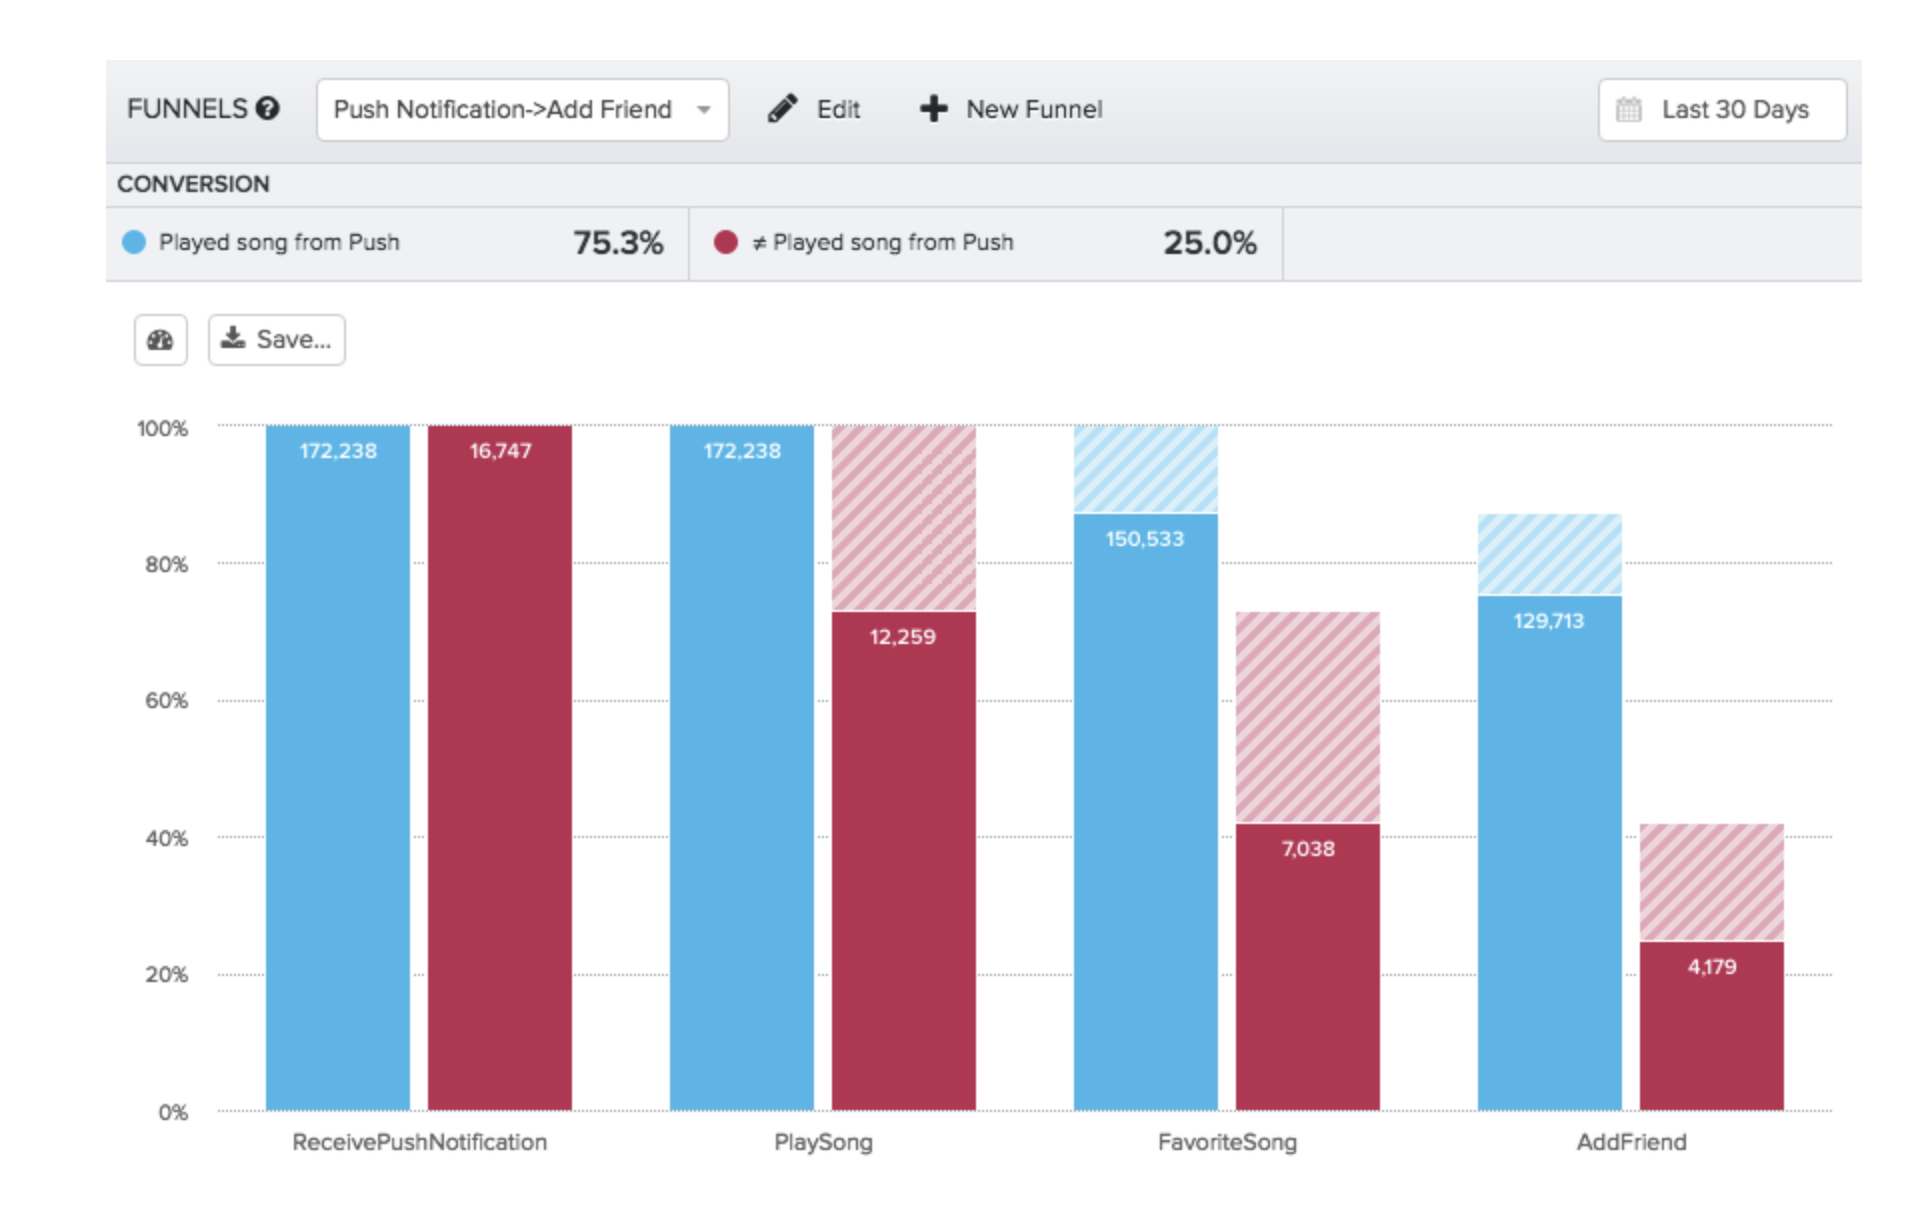
Build funnels based on different user groups:
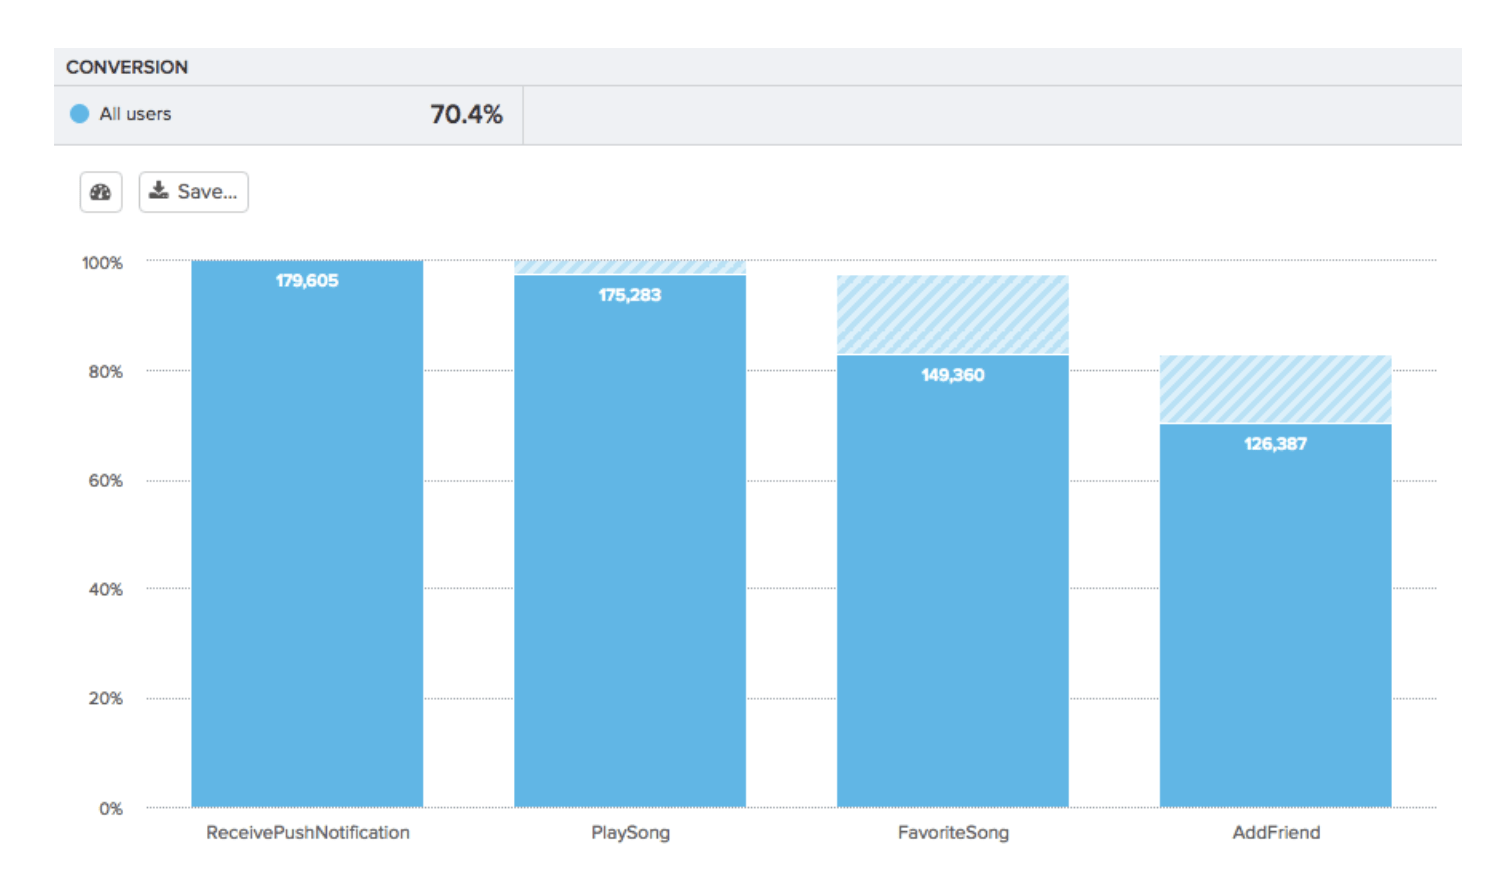
Analyze your conversions:
Get detailed statistics:
More Exciting Features
- The tool prioritizes collaboration:
- Amplitude offers “Team Spaces” for departments, teams, and separate projects to work in their own environments.
- “TV Mode” allows you to broadcast dashboards across the organization to present your latest figures.
- Increase your team’s efficiency with the available analytics templates.
- Data and insights can be shared easily (e.g. via Slack).
- You can add definitions right in the tool to ensure your colleagues understand what every event means. Chart elements and labels can be renamed, as well as additional insights added for additional background.
- There is a vast variety of integrations available from attribution to in-app purchases, deep linking, A/B testing, mobile marketing automation, data warehousing, customer data, collaboration, and business intelligence.
- Examples are: Salesforce, Tableau, Segment, Snowflake, Amazon & S3 & Redshift, Slack, Apptimize, Airship, Adobe, and many more.
- In order to keep an accurate count of users, Amplitude uses a system of User IDs, Device IDs, and Amplitude IDs to identify users. This way, it can merge users and their behavior (events data) when, for example, a user upgrades his phone. Cross-platform tracking is possible with this as well and anonymous events are attributed to the right users.
Pricing plan
While Amplitude does offer a free version with up to 10 million actions per month, the jump to the next pricing level is significant. If you have the budget, however, the first paid tier of Amplitude has a strong set of behavioral and predictive reports.
Security & Compliance
Customers have full ownership of their data. All data that is sent to the Amplitude platform for processing belongs to the customer. Amplitude’s customers have full control over what kind of data is collected, processed, and stored.
Your organization’s ingestion rules can be specified to protect sensitive data and avoid accidentally collecting PII information, e.g. remove IP addresses and location data from stored events. An easy-to-use API endpoint allows its customers to submit requests to delete all data for a user’s Amplitude ID and/or User ID.
Amplitude is cloud-hosted in Amazon Web Servers and stores its data in the US region. This can lead to complications regarding the lastest declaration of the European Court of Justice whereby the EU/US Privacy Shield is ineffective. Refer to our guidelines regarding GDPR compliance and the impact of the new Privacy Shield regulation.
Level of Support
The platform offers a vast range of support, in a variety of forms such as:
- Help Center
- Library of video walkthroughs
- On-standby team for advice
- Education Center: Virtual training courses, webinars, content library
- Blog with detailed guides, updates, and news
- Server Status Updates
- New user onboarding that provides personalized content depending on the employee’s new team
Difficulty of Implementation
Setting up Amplitude requires developer input. For your iOS or Android apps, you need to set up the tracking SDK (Software Development Kit). While some of the data is included in the default tracking, your custom events and user properties are not tracked automatically and are specified as custom tracking code. Additionally, user properties – that are collected along with events – such as country, age, or the device model, must be specified as well.
Conclusion
The manual tracking in Amplitude is certainly not easy and requires technical input. However, if you are comfortable with custom tracking code, this will definitely provide you with a lot of freedom. Amplitude lets you decide which information is important for your product team and you have autonomy of decision over every metric and dimension. This data control also helps to mitigate possible issues in connection with auto-event tracking and GDPR.
If you want to bridge the gap between marketing and product insights, we recommend using both Google Analytics and Amplitude. While Google Analytics is focused specifically on the efficiency of marketing channels, Amplitude can offer you everything beyond your marketing site and highlight your user’s journeys.
If you need help in your decision-making or tracking, we are excited to find a customized solution for you.
Note: The reason we have not picked Google’s new Web + App is not that we do not believe in it but because we have covered it extensively already, read more here.