The Google AdWords report editor will be introduced in the next months, as Google recently announced. The report editor is a new AdWords tool that displays tables and charts visually. At the moment this function, announced a year ago, is activated only for a few accounts.
The report editor is already activated for our account and we show you how to use it.
How to Use the Report Editor:
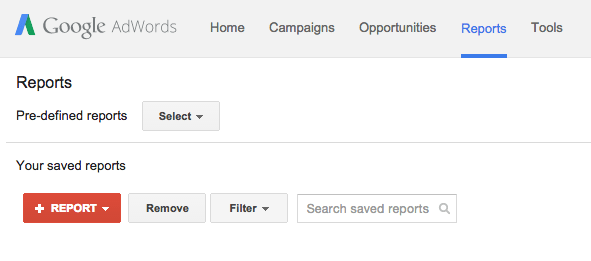
If the report editor is already activated for your AdWords account, you can find it in the main navigation menu.

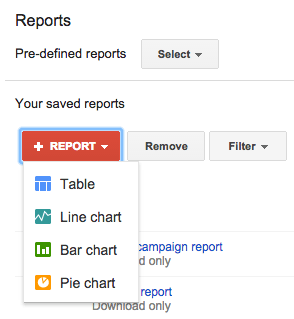
Choose a report type under +Report. We chose the table presentation for our example.

Now you can drag and drop your important report metrics from the left column into the big empty field. In this big field the metrics can be filtered with the drop down menu under the arrow. You can filter, like in Google‘s example the ad group or the number of clicks (only in the table).

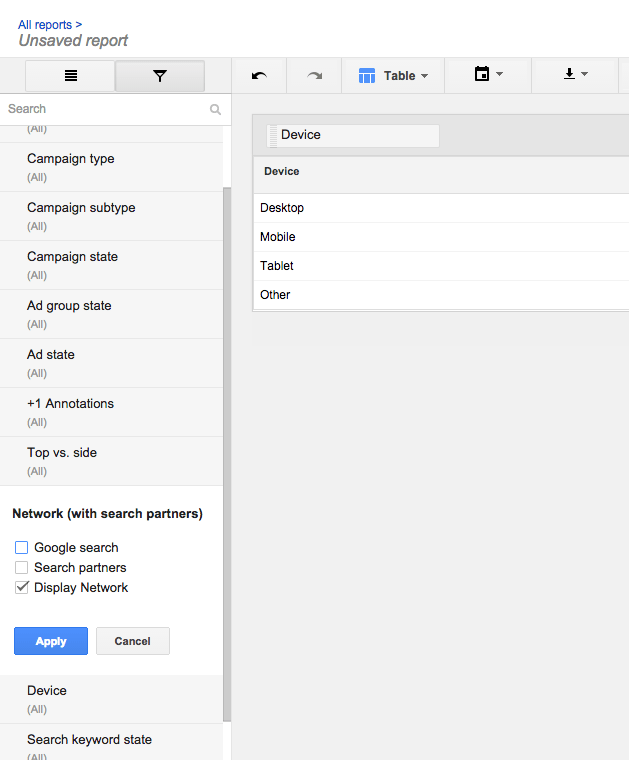
For more detailed reports click on the filter symbol in the navigation menu. Here you can filter for example based on the network or the weekday and you can break down the report in more detail.

Actions can be undone or redone with a click on the arrows in the navigation menu.
If you do not like the table visualization, you can choose between three different charts: line chart, bar chart or pie chart.
The report can be created and sent automatically as a PDF or PNG and you are able to schedule the sending.
The report editor lets you create graphic reports very easily. The big benefit of the report editor is that you can evaluate and present your AdWords data visually without downloading it.
If you have any questions concerning the creation of a report with the report editor, contact me by email.