Google Data Studio is Google’s free dashboarding tool that is making it incredibly easy to create useful and visually appealing dashboards.
If you are unfamiliar with Google Data Studio, take a look at this blog post on how to get started with your first dashboard.
One of the few disadvantages of Google Data Studio was always the inability to combine multiple data sources in one chart or widget. With the release of data blending though, this has all changed.
In this blog post, we will take you through a quick explanation of how to combine data sources by using the new Google Data Studio Data Blending functionality.
Why would you need to combine Data Sources?
Before we get started with the “how to” of combining data sources, we want to quickly explain what data blending allows us to do.
Previously, when comparing data from multiple data sources (such as Google Analytics, Google AdWords and Google Search Console), you would need to have separate widgets side by side. Something like this:


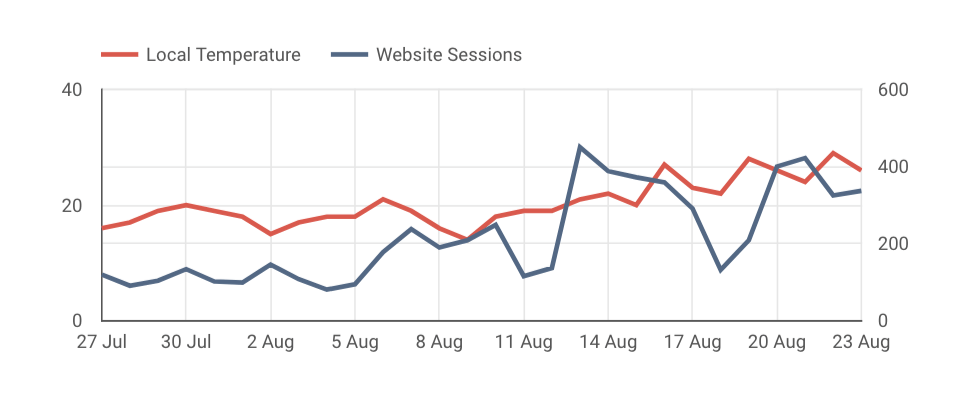
As you can see, this opens up a whole new avenue of possibility in Google Data Studio. So let’s see how you can get started.
Combining Data Sources in Google Data Studio
Option 1: Combine Widgets
The easiest way to combine data sources in Data Studio is simply to combine widgets. It is especially useful if you have already created separate widgets and now want to combine them.
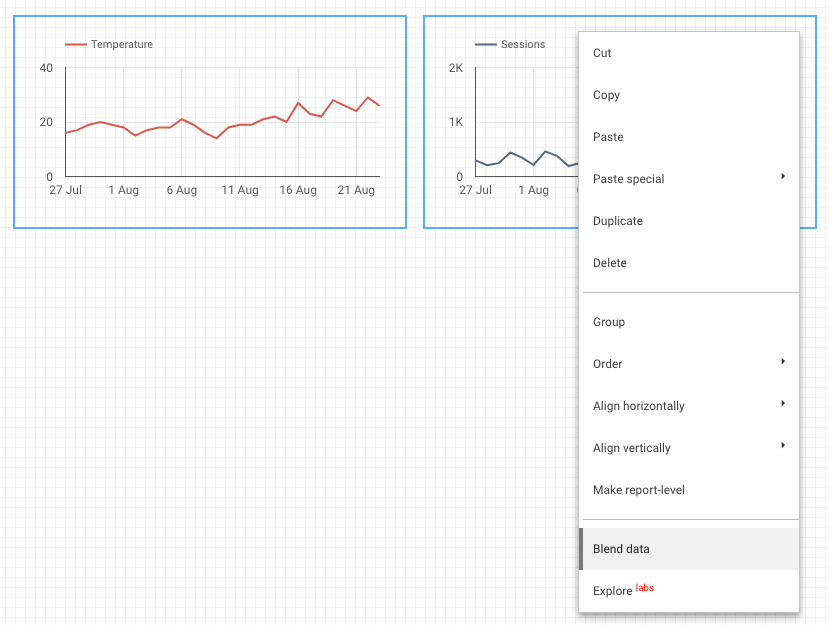
- Select the widgets that you want to combine, in this example, we are going to use the temperature widget and a website sessions widget.
- Then right click and select “Blend data”.
Option 2: Combine from Resource Menu
- In the menu, select Resource > Manage blended data
- Click on Add a data view
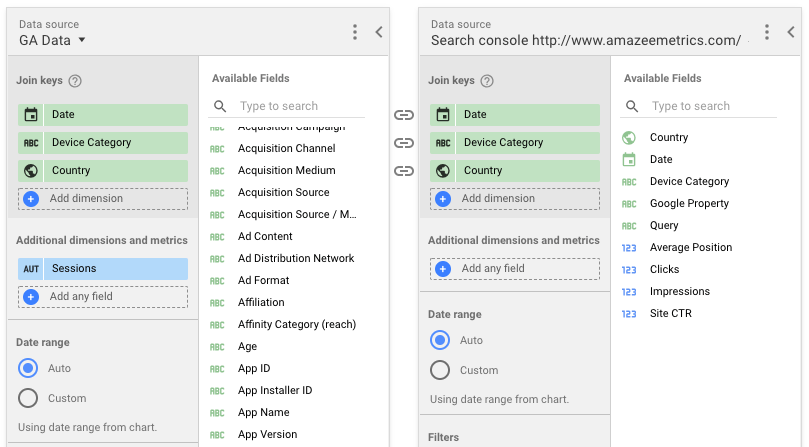
- Select the two or more data sources that you want to combine.
- Then select a join key, in our example we are going to join our data sources based on date.

Configuring Merged Data Sources
If you have combined your data sources from the resource menu, you can further configure your merge on the same page.
If you combined widgets to blend your data, simply navigate to Resource > Manage blended data
On this page, you are able to further configure your combined data source in a number of ways. Here are some of the possible changes you might want to make:
1) Change the join key
The primary join key that we have found ourselves using is Date. However, there are many scenarios where we may want to join data based on a different key, for example: device or country. If you are unsure of what a join key is, or how to use this, take a look at this explanation of joining data tables.
2) Add additional join keys
In addition to changing the join key, we can also add more join keys. For example, we might want to join our data based on the device, country and the date. In order to do this, we can simply add more join keys so that your data blend looks like this:
This will allow you to see metrics from both of the data sources and segmented by all three of the keys.
3) Add more metrics or dimensions
You can also add more metrics to an existing blended data source. This is perfect if you have created a data source by combining widgets and you want to re-use the data source but with additional metrics.
4) Add more data sources to your blended data source
In addition to adding more metrics and dimensions, you can also add more data sources to your blended data source. In order to do this, you will need to make sure that any data source you add to your blended data source shares the same join keys.
5) Filter your blended data source
Within the configuration page, you are also able to set up filters for your combined data. This functions in exactly the same way as the normal Data Studio filters that you can apply to standard data sources.
6) Rename your blended data source
While this isn’t the most complicated or powerful thing you can do with blended data sources, it is important to keep your dashboards consistent and understandable. Renaming your blended data sources is an important step in this process.
Considerations for Merged Data
The most important thing to be aware of when combining data sources is your join key, or join keys. When selecting a join key, Data Studio automatically selects a join key from your other data source, provided it finds a dimension with the same name.
However, if you are working with data from custom data sources, you might find that differences in naming convention cause some trouble here. Always make sure that you have the same type of data for your join key in all of your merged data sources.
Another thing to keep in mind is that your metrics are still associated to specific dimensions. Which means that any dimensions that you add, without joining to the other data source, will only work with metrics from their initial data source.
Finally, while this is an amazing step forward for Google Data Studio, just because the functionality exists does not mean you need to use it in every widget. Be careful of over-complicating your dashboards by joining too many data sources.
If you have any questions about combining data sources in Google Data Studio, you can send me an email.