
Are you wasting your marketing budget on cost-ineffective campaigns? How can you easily compare the performance and costs of your Google Ads, Facebook, Bing, newsletters or other marketing campaigns in one simple report?
We have an easy solution for you: upload data about your non-Google campaigns into Google Analytics. This will enable the Cost Analysis report, which shows you how all your different campaigns compare across important campaign metrics: sessions, impressions, clicks, CTR, CPC and cost.
This tutorial will show you a simple method to upload your campaign data to Google Analytics so that you can use Cost Analysis reports.
1. Use custom campaign URLs.
You must make sure that all the URLs that you use in all your campaigns use UTM tags. Many campaign tools can generate UTM tags for you. If your tools do not automatically tag your campaigns, you should use the Google URL builder to do it manually.
2. Create an Excel template for your campaign data.
Google Analytics can create an Excel template for you to use to build a dataset.
- In the Admin section of your Google Analytics property, click “Data Import”.
- Click “+ New Data Set”.
- Select “Cost Data”, then “Next Step”.
- Give the dataset a name and select which Google Analytics Views should have access to the data.
- Use the Data set schema options to select which columns should be included. At the very minimum, you should select “Cost”, but if you have good data about other campaign metrics, you can include those too.
- Select “Summation” or “Overwrite”. If you select “Summation”, when you upload new data for example, for January, that new data will be added to any January data you previously uploaded. If you select “Overwrite”, that new January data will replace any January data you previously uploaded.
- Click “Done”.
- Click “Get schema”. This creates a CSV header and an Excel template for the schema. Click “Download schema template” to get an Excel file you can fill in with your data.

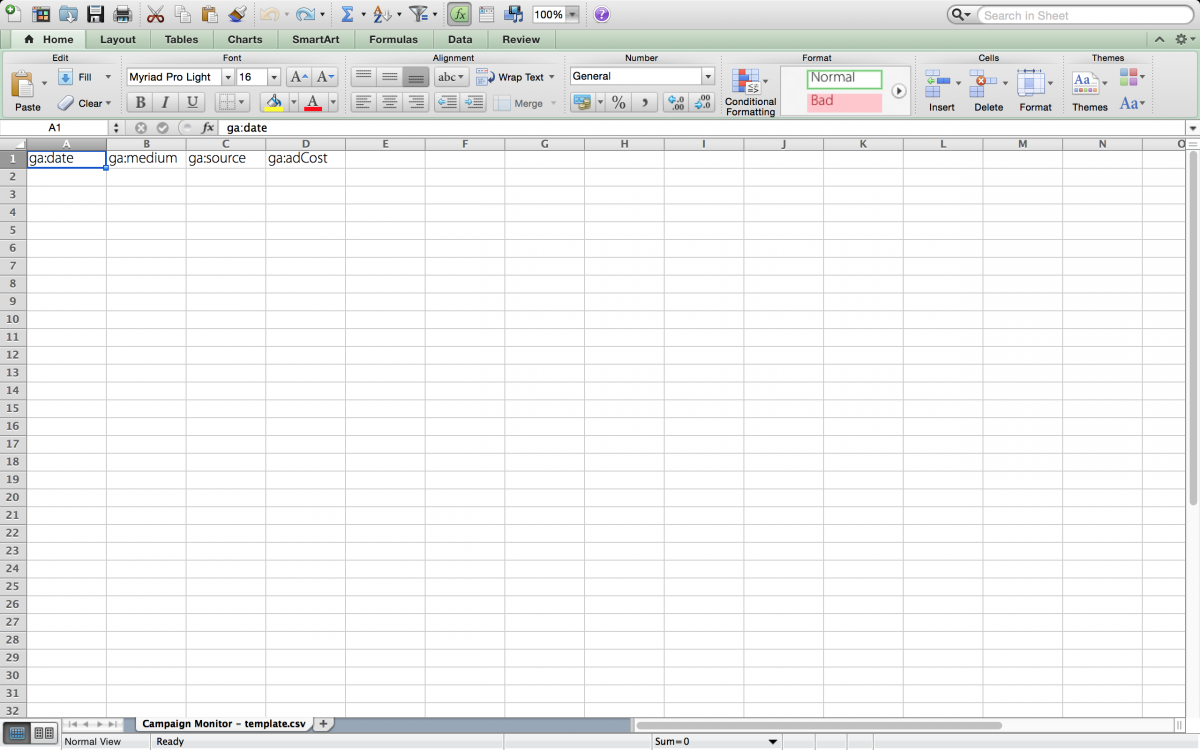
3. Enter campaign data into the Excel template.
Use Excel to open up the schema template you downloaded. You will see the column headings are already present, all you need to do is add rows of data. Some important guidelines to keep in mind:
- You must use YYYYMMDD date format, for example, 20150702 to indicate 2 July, 2015.
- You should use exactly the same spellings and capitalization for Medium and Source that you used in the campaign UTM tags.
- Cost should contain no currency characters, no commas or other thousands separators, and should use two decimal places. The number format should look like this: 1534.25
Once you have entered your campaign data, save this file as a CSV file.
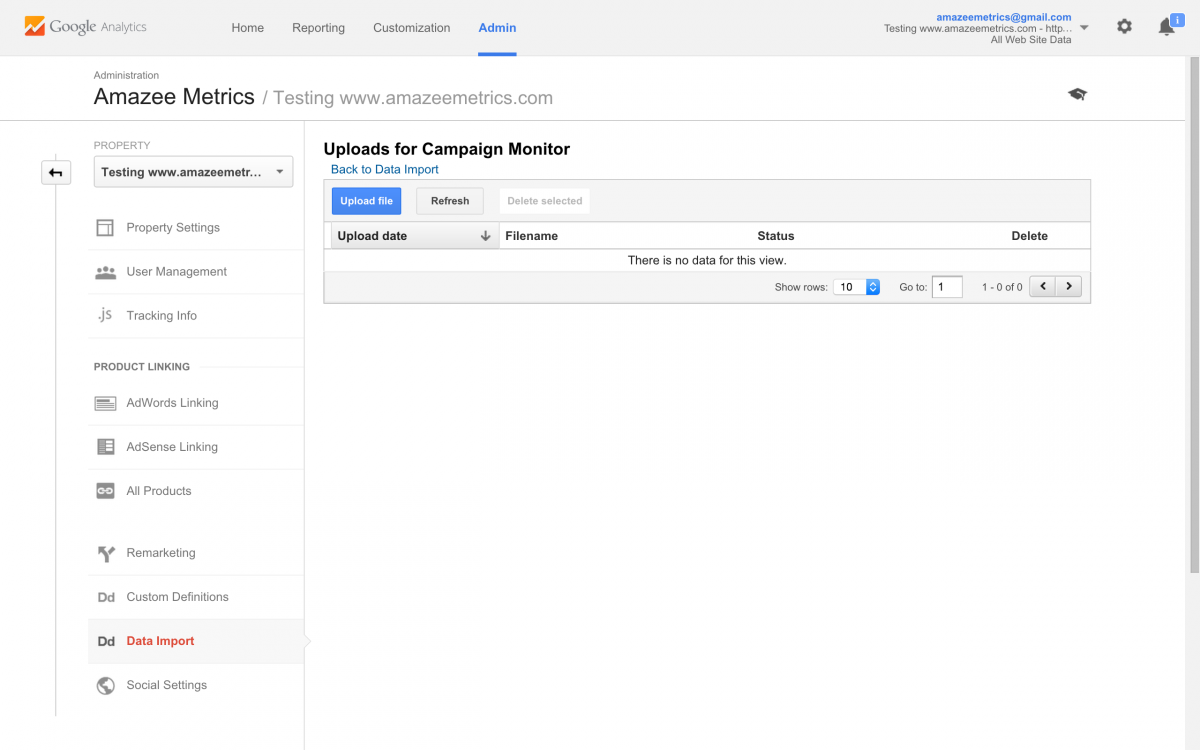
4. Upload the CSV file to Google Analytics.
- In the Admin section of your Google Analytics property, click “Data Import”.
- Click “Manage uploads”.
- Click “Upload file”.
- Choose your CSV file and click “Upload”.
5. Report on your data.
You can now view the costs for the campaigns you uploaded in the Cost Analysis report. The Cost Analysis report provides marketing professionals with a good way to see which of their campaigns are paying off, and which cost more than they are worth.
This tutorial describes one method of uploading cost data to Google Analytics. There are also ways to automate this process with the help of an experienced developer.