Google Analytics is testing some new features that could be very useful to understand user behavior: Active Users and Cohort Analysis.
Active Users

The Active Users report shows a quick overview of the number of users that have had at least one session daily, weekly and monthly. This is a nice complement to the existing user behavior reports, especially the frequency and recency report.
Cohort Analysis
Cohort Analysis is a way to analyze behavior by segmenting users into groups that have had similar experiences within a given timespan. So instead of telling us just the total number of users who filled out a form last week, it can tell us that 20% of users who first visited a site on Monday filled out a form on Wednesday. This is a powerful way to understand patterns and derive the truly useful, actionable insights into user behavior.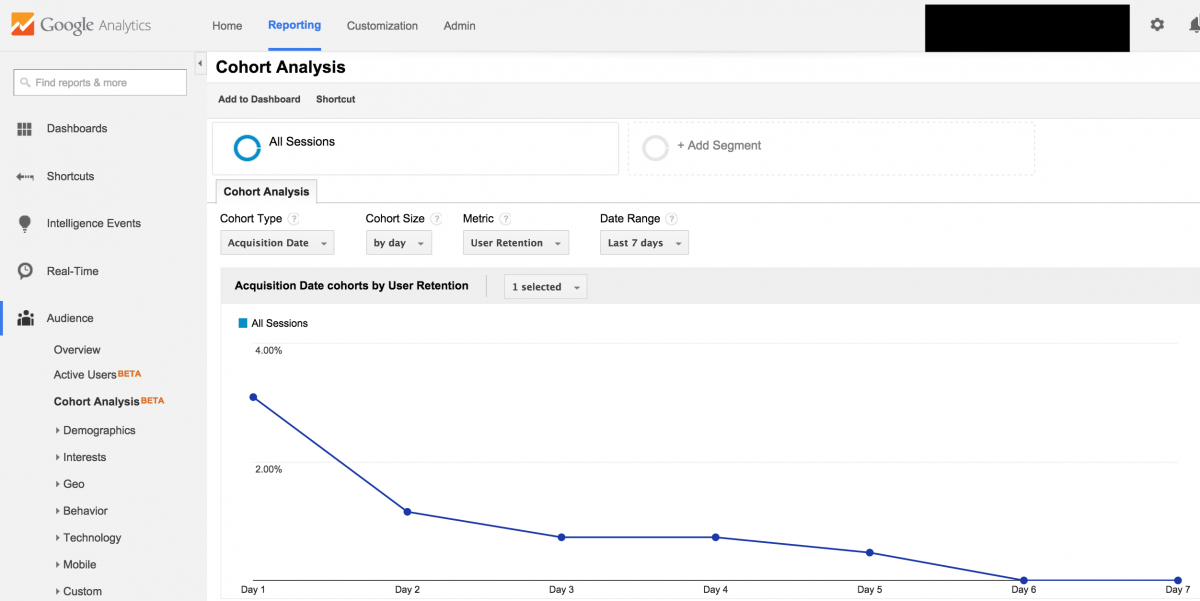 The report allows us to select:
- Cohort Type (The Beta version of the Google Analytics Cohort Analysis is limited to only acquisition date cohorts.)
- Cohort Size (by day, by week, by month)
-
Metrics:
- By User (goal completion, pageviews, revenue, session duration, sessions, transactions)
- Retention
- Total (goal completion, pageviews, revenue, session duration, sessions, transactions)
- Date Range
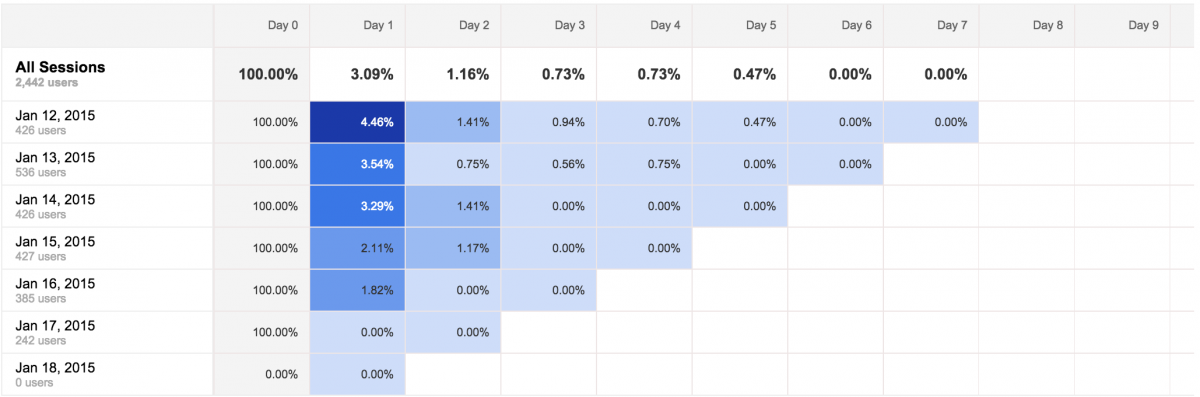 The chart above shows us that users whose first visit was on Monday, January 12 had the highest retention rate: 4.5% of them visited again the next day.
These new features are the latest examples of a shift in Google Analytics towards providing more user-centric analysis. To stay up to date on the latest developments in web analytics, subscribe to this blog or sign up for our newsletter.