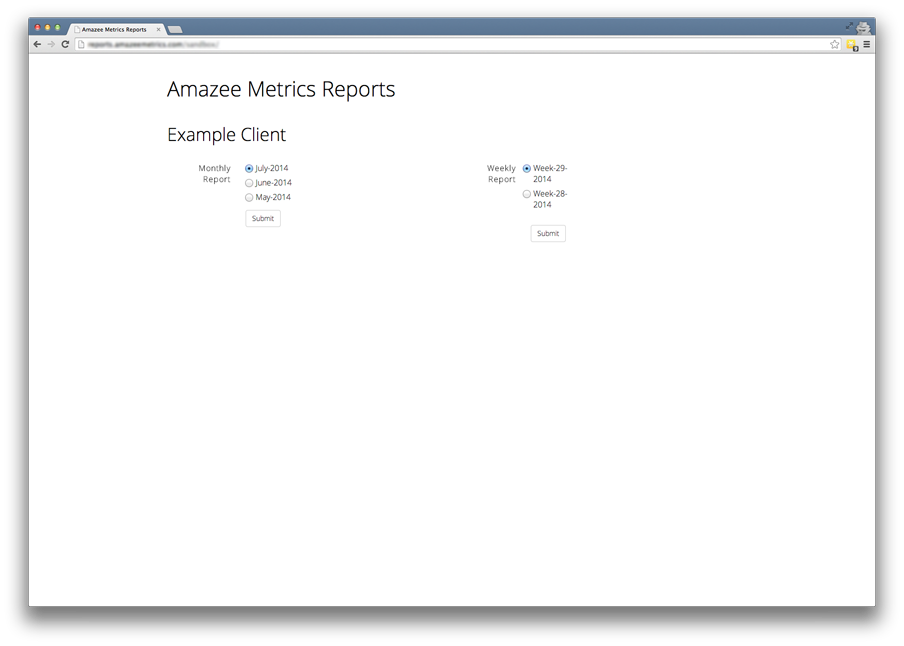
We are happy to present our new Web Reporting Tool. It was our goal to provide our customers with an easy tool that allows you to access your weekly and monthly web reports from any place, at any time and to provide a well designed report which is easy to understand.
The web reports are accessible through a web login and visualized with charts. After entering the correct login details, an overview of the available data is presented.

After selecting the desired month, the report is shown with thumbnails to gain a quick overview.

By clicking on any thumbnail the format changes to full screen and you are now able to navigate through the slides using the mouse or the arrow keys, as you know it from PowerPoint.
With the Esc key you are able to exit the slide view and go back to the overview. There is also a useful „Print“ button that allows you to save the report as PDF or to send it to your printer.
There are various types of charts available to visualize your data.


As we have implemented a responsive template, your reports are easy accesible from mobile devices.

If you are interested in this kind of web reporting, please do not hesitate to contact me: richard.egloff@advance-metrics.com.


